The curve doesn't care what runs it.
A single technology rides an S-curve: slow start, steep middle, saturation ceiling. The exponential everyone quotes is a cascade of those curves. The dangerous question is which one you are riding -- and whether someone is quietly starting the next one underneath you.
In 1999, in The Age of Spiritual Machines, Ray Kurzweil made a prediction that sounded absurd at the time: human-level artificial intelligence by 2029. He has reaffirmed it for a quarter of a century since, most recently in The Singularity Is Nearer (Viking, June 25, 2024), the New York Times bestseller he wrote as a Principal Researcher and AI Visionary at Google, where he has worked since 2012.
You can take the 2029 date or leave it. That is not the interesting part. The interesting part is the engine he built underneath it -- the Law of Accelerating Returns, an idea he first set out in 1999 and named in a 2001 essay. And one claim inside it is the most useful timing tool a navigator can carry: the exponential trend in computing does not depend on any particular technology. The curve does not care what runs it. The rest of this piece is about why that is true, where Kurzweil's own numbers should be read with a careful eye, and how the same lens reads the curve under your own field.
One technology rides an S-curve. People misread it two opposite ways.
Take any single technology in isolation and its progress traces an S: a slow start while the thing barely works, a steep middle where it improves fast, and a saturation ceiling where it bumps into a physical, economic, or adoption limit and flattens out. That shape is one of the most reliable patterns in the study of technology, formalized by Richard Foster in Innovation: The Attacker's Advantage (1986).
The trouble lives in the steep middle, because from inside it you cannot see the shape. So people make one of two opposite errors. They read the steep part as a straight line and underestimate what is coming, the way nearly everyone under-forecast the early internet and mobile. Or they read the steep part as forever-vertical and price in infinite growth, missing the ceiling that every individual technology eventually hits. Same segment, two wrong conclusions. The ruler does not tell you which one you are looking at.
Both errors come from staring at a single curve. The resolution comes from realizing that the long exponential everyone argues about is not a single curve at all.
The technology underneath changed five times. The trend never bent.
The exponential is a cascade of overlapping S-curves.
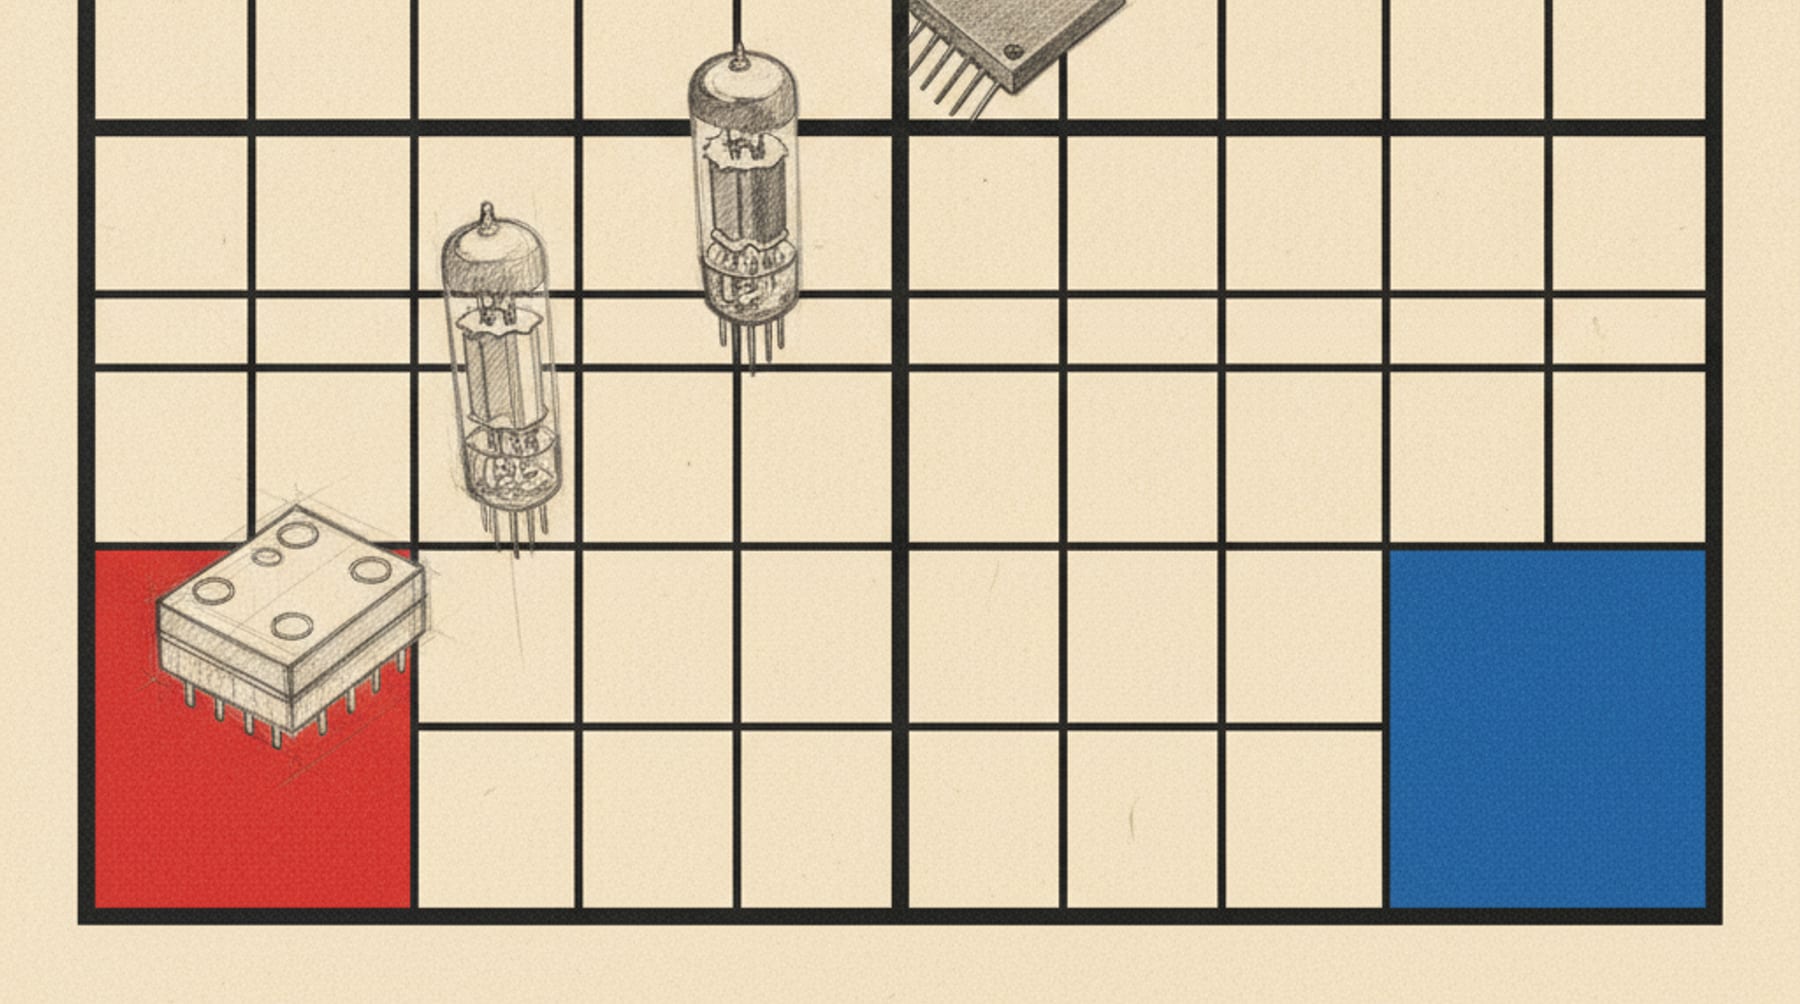
Here is Kurzweil's genuine insight, and it is the part worth keeping. Plot the price-performance of computation back to 1939 and you get a straight line on a log scale -- a clean exponential. But the technology under that line changed five times: mechanical relays, then vacuum tubes, then transistors, then integrated circuits, and most recently GPUs and AI accelerators. Each of those is its own S-curve. Each one started slow, climbed steeply, and saturated. And yet the overall line never bent.
It never bent because the next paradigm started climbing before the previous one flattened. The new curve picked up the trend exactly where the old one was running out of room. That overlap is the whole trick. The envelope across the tops of all five curves stays exponential precisely because no single technology has to carry it the whole way. This is what the title means, and it is genuinely Kurzweil's framing in his price-performance paradigm chart: the curve does not care what runs it. When one substrate hits its ceiling, another takes over, and the line keeps climbing as if nothing happened.
So both reading errors dissolve at once. The line is not really straight (so the straight-line reader underestimates), and no single curve is vertical forever (so the forever-vertical reader is wrong too). The exponential is real, but it is a relay race, not a single runner.
The shape is solid. The scorecard is self-reported.
This is where a sophisticated reader has to be careful, because Kurzweil's presentation mixes a robust structural claim with numbers that are his own. The cascade of S-curves is well grounded. The specific figures around it are not independently audited, and it matters to say so plainly.
Start with the famous accuracy claim. The often-quoted “86 percent” comes from Kurzweil's own 2010 review, “How My Predictions Are Faring,” in which he graded his own 147 predictions and counted 115 as “entirely correct” and another 12 as “essentially correct.” By his own count, that is impressive. But it is a self-grading exercise, not an independent audit, and the rubric is generous about what counts as correct. Read it as “by his own scorecard,” never as a neutral fact. (Background: Ray Kurzweil.)
The same caution applies to the big numbers in The Singularity Is Nearer: a roughly 75-quadrillion-fold gain in hardware price-performance since 1939, around 11,200 times more compute per dollar since 2005, and a roughly millionfold gain in software efficiency. These come from Kurzweil's own proprietary chart, not from an independent measurement. The frequently repeated “about 10x improvement per year” is an approximation, not a precise figure; independent estimates of effective AI-compute growth land in a wide band rather than on a single clean multiple. Treat all of these as Kurzweil's own measure, and do not quote the 10x as exact.
One more correction, because the legend tends to inflate it: Kurzweil was a genuine prodigy young -- he appeared on television in 1965, at 17, with a computer he built that composed music -- but he did not formulate the exponential-growth thesis as a teenager. That came later, as an adult, across 1990 and 1999. The prodigy story is true. The thesis-as-a-teenager story is not. None of this weakens the structural point. It just keeps the structural point separate from the salesmanship around it.
How to read the curve under your own field.
The middle of an S-curve looks linear, so people extend it as a straight line and underestimate what is coming. The early internet, mobile, and AI all got under-forecast this way. The steep part is steeper than a ruler suggests, because the curve is still bending upward beneath the segment you can see.
The opposite mistake. People in the steep part assume it never ends and price in infinite growth. But every single technology has a ceiling -- a physical, economic, or adoption limit. Transistors hit atoms. Read the steep part as permanent and you miss the saturation that is already approaching.
Each paradigm is its own S-curve that saturates. But the next paradigm starts climbing before the previous one flattens, so the overall envelope stays exponential. Relays, tubes, transistors, integrated circuits, GPUs, AI accelerators: five handoffs, one straight line of price-performance back to 1939. The trend never bent because something new was always already climbing.
Inside the steep middle, both readings feel true and you cannot tell them apart by looking up. You tell them apart by looking down -- at the paradigm. Is the technology under you still climbing its own S-curve, or is it near the ceiling while a different one starts underneath? That is the question that separates a Nvidia bet from a Kodak bet.
Timing is the gap between Nvidia and Kodak.
The cascade is not just a chart about the past. It is happening right now, in public. Across 2024 to 2026, the major AI labs converged on near-term timelines for human-level systems -- the kind of cluster of expert opinion that, in S-curve terms, marks the steep part of a new paradigm climbing fast. Whether you believe the dates, the convergence itself is a timing signal: a new curve is carrying the trend, and the old assumptions about how slowly capability improves are getting overtaken.
That is exactly the moment where reading the curve correctly separates winners from casualties. Nvidia read the handoff -- general-purpose compute giving way to accelerated, parallel compute -- and positioned at the base of the new curve. Kodak, which had invented the digital sensor in 1975, read its own film curve as permanent and optimized it toward the ceiling while the new curve climbed underneath. Same era, same information available, opposite timing reads. One rode the next S-curve; the other defended the last one.
The structure here is the one Utterback and Abernathy described as the era of ferment before a dominant designsettles: the moment a new paradigm starts climbing is precisely when incumbents are most tempted to keep polishing the old one. The navigator's advantage is not predicting which technology wins. It is asking the prior question: is my field on a single S-curve near its ceiling, or at the base of a new one?
This one is not a metaphor. It is a clock.
The S-curve is not a story MindrianOS tells. It is a first-class move it runs. /mos:analyze-timingplaces your field's core technology on the S-curve clock -- early signal, inflection, rapid diffusion, or approaching ceiling -- and surfaces the position as a decision gate, so you argue about where you sit on the curve before you bet a single dollar on its continuation.
For the same timing lens applied to a domain that dissolved rather than handed off, see the great horse manure crisis. That piece is about a curve that ended; this one is about a curve that keeps getting handed to the next runner. Both come down to the same question the whole category keeps skipping: which curve am I actually on, before I bet on it continuing?
You think the line is straight. You are standing on a curve that ends.
So test it. Copy the question below, drop it into MindrianOS, and place your field on the S-curve clock before you trust the line to keep climbing. Larry will not hand you a forecast. He finds which paradigm is carrying the trend, asks whether the next one is already climbing, and picks the move to match. Bet you cannot name your own ceiling before he does.
Copy this. Fill in your field. Paste it into MindrianOS.
I want to understand the timing in my domain, and I am not sure whether I am riding a curve that is about to flatten or sitting at the base of a new one.

My domain: [DESCRIBE YOUR FIELD IN ONE OR TWO LINES -- what you research, build, or operate, and the core technology or capability everything else depends on].

Here is what I notice. For as long as anyone in my field can remember, the core capability has improved on a steady, almost straight upward line. People plan as if that line continues forever. But a single technology does not climb forever -- it follows an S-curve: slow start, steep middle, then a saturation ceiling. I cannot tell from inside whether the steep part I am in is still climbing, or whether I am approaching the ceiling while a different paradigm quietly starts its own S-curve underneath me.

It reminds me of the computing story. The straight exponential line of price-performance runs back to 1939, but the technology underneath it changed five times -- relays, vacuum tubes, transistors, integrated circuits, then GPUs and AI accelerators. Each was its own S-curve that saturated. The trend never bent because the next paradigm started climbing before the last one flattened. The curve did not care what ran it.

Help me think through this properly. First: is my field on a single S-curve approaching its ceiling, or at the base of a new one? Do not jump to a strategy. Place it on the curve, show me which paradigm is actually carrying the trend right now and which one might carry it next, and tell me where the real opening is -- the bet that rides the next curve rather than optimizing the one that is about to flatten.
Six moves, curve first.
Each command is copyable. Every one is a real MindrianOS move, documented in the catalog. The notes track the running example: the computing price-performance cascade and the substrate-independent curve.
- 1Open a room and describe your domain
Larry does not start with a forecast. He reads the domain structure first -- which core capability everything depends on, and whether it is one curve or a cascade.
On the computing curveComputing's core capability is price-performance of computation. Read it as one curve and you miss the handoffs. Read it as a cascade and the whole 1939-to-now line makes sense.
- 2Push the current curve to its extreme
Take the trend your field is riding and extrapolate it until either the straight line or the ceiling becomes obvious. The extreme is where the two reading errors separate.
On the computing curvePush transistor density far enough and you hit atoms. The single-curve reading breaks. That break is the cue that the trend has to jump paradigms or stop.
- 3Find the paradigm climbing underneath
Maps the macro forces -- technology, economics, physics, capital -- and surfaces which new S-curve is on the steep part of its own adoption, before the current one flattens.
On the computing curveGPUs and AI accelerators were climbing while CPUs flattened. By Kurzweil's own measure the price-performance line never bent, because the next curve was already underway.
- 4Place the curve on the clock
Early signal, inflection, rapid diffusion, or approaching ceiling. The clock position changes the move entirely. This is the move the whole piece is about: reading where you sit on the S-curve.
On the computing curveThe gap between Nvidia and Kodak is a timing read. One bet on the new curve at inflection; the other optimized the old curve toward its ceiling.
- 5Borrow a handoff from another field
The cascade of overlapping S-curves repeats across industries. Same shape, different material. Cross-domain analogy is where the real timing model comes from.
On the computing curveRelays to tubes to transistors is the same handoff shape as sail to steam, or film to digital sensors. The paradigm changes; the envelope keeps climbing.
- 6Turn the signals into a timing position
Climbs from scattered signals to a timing thesis you can defend, act on, and keep watching. You leave with a position on the curve, not a prediction of the date.
On the computing curveThe position is not 'AI keeps doubling.' It is 'my field's current curve saturates near here, the next one is climbing there, and this is the bet that rides it.'
- The 2029 prediction -- verified. Kurzweil first predicted human-level AI by 2029 in The Age of Spiritual Machines (1999) and has reaffirmed it since, including in The Singularity Is Nearer (2024). Sources: Wikipedia, Ray Kurzweil; Peter Diamandis, “Age of Abundance: Human-Level AI”.
- Role and publication -- verified. Kurzweil is a Principal Researcher and AI Visionary at Google (since 2012); The Singularity Is Nearer was published June 25, 2024 (Viking/Penguin) and reached the New York Times bestseller list. Sources: Penguin Random House; The Guardian (June 2024).
- Law of Accelerating Returns -- verified. The idea first appeared in 1999; the named essay was published March 7, 2001. Source: Wikipedia, The Law of Accelerating Returns.
- Substrate independence -- Kurzweil's own framing. Relays, vacuum tubes, transistors, integrated circuits, GPUs, and AI accelerators all fall on one straight line of price-performance back to 1939; the technology underneath changed five times and the trend never bent. This is the Price-Performance of Computation paradigm chart from his work. Source: Wikipedia, Ray Kurzweil.
- The “86 percent” accuracy -- self-reported, flagged.The figure comes from Kurzweil's own 2010 “How My Predictions Are Faring,” in which he graded his own 147 predictions (115 “entirely correct” plus 12 “essentially correct”). It is not independently audited and the self-grading is generous. Phrase as “by his own count.” Source: Wikipedia, Ray Kurzweil.
- The big numbers -- Kurzweil's own measure, flagged.The roughly 75-quadrillion-fold hardware gain since 1939, the roughly 11,200x compute per dollar since 2005, and the roughly millionfold software gain come from Kurzweil's own proprietary chart in The Singularity Is Nearer(2024), not an independent audit. The “about 10x per year” figure is an approximation; independent estimates of effective AI-compute growth land in a wide band. Frame as Kurzweil's own measure.
- Technology S-curve theory. The S-curve and its ceiling are from Richard Foster, Innovation: The Attacker's Advantage (1986); the era of ferment before a dominant design settles is from Utterback and Abernathy. Overview: Technological change (the S-curve).
- MindrianOS Brain. The S-curve clock (place a technology on the timing curve, read whether it is climbing or saturating, watch for the next paradigm starting underneath) and the cascade-of-S-curves framing are drawn from the teaching corpus (30+ years of PWS instruction).
Ready when you are. Install MindrianOS. Start reading the curve.